Installation Guide for Distributed Deployment
Enhance your ServiceOps performance, scalability, and security by deploying the application and database servers on separate, dedicated machines.
ServiceOps supports a distributed architecture where the application server and database server can be deployed on separate machines. This configuration provides several benefits including improved performance, better resource utilization, enhanced scalability, and simplified maintenance.
In a distributed deployment, ServiceOps components are separated across multiple servers:
- Application Server: Hosts the ServiceOps web application, business logic, and user interface
- Database Server: Dedicated PostgreSQL database server for data storage and management
This architecture is particularly beneficial for:
- Large-scale deployments with high concurrent user loads
- Organizations requiring enhanced performance and scalability
- Environments where database and application workloads need to be isolated
- Compliance requirements that mandate separate database servers
Prerequisites
- Before performing a distributed deployment, ensure that your application is first installed in standalone mode on any of the supported operating systems (Ubuntu, RHEL, or ISO).
- Before configuring separate application and database servers, ensure you have met the System Requirements and Pre-Installation Checklist.
Architecture Example
For this guide, we'll use the following example configuration:
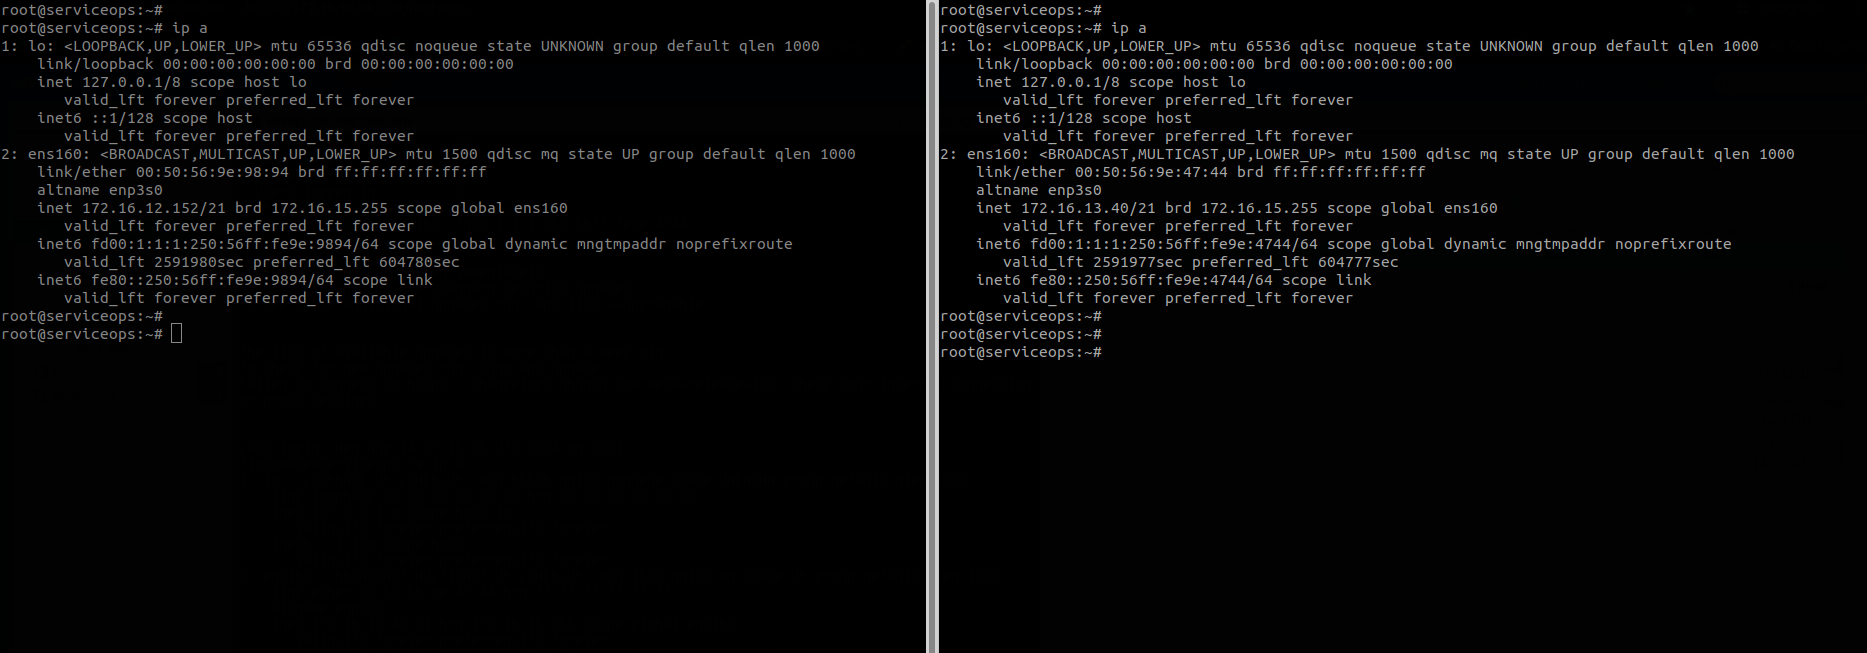
- Application Server IP: 172.16.12.152
- Database Server IP: 172.16.13.40
- Operating System: Ubuntu 22.04 LTS
Configuration
Step 1: Stop Services on Application Server
First, stop all ServiceOps services on the application server to prepare for the configuration change.
Stop ServiceOps Application Services:
systemctl stop ft-main-server
systemctl stop ft-analytics-server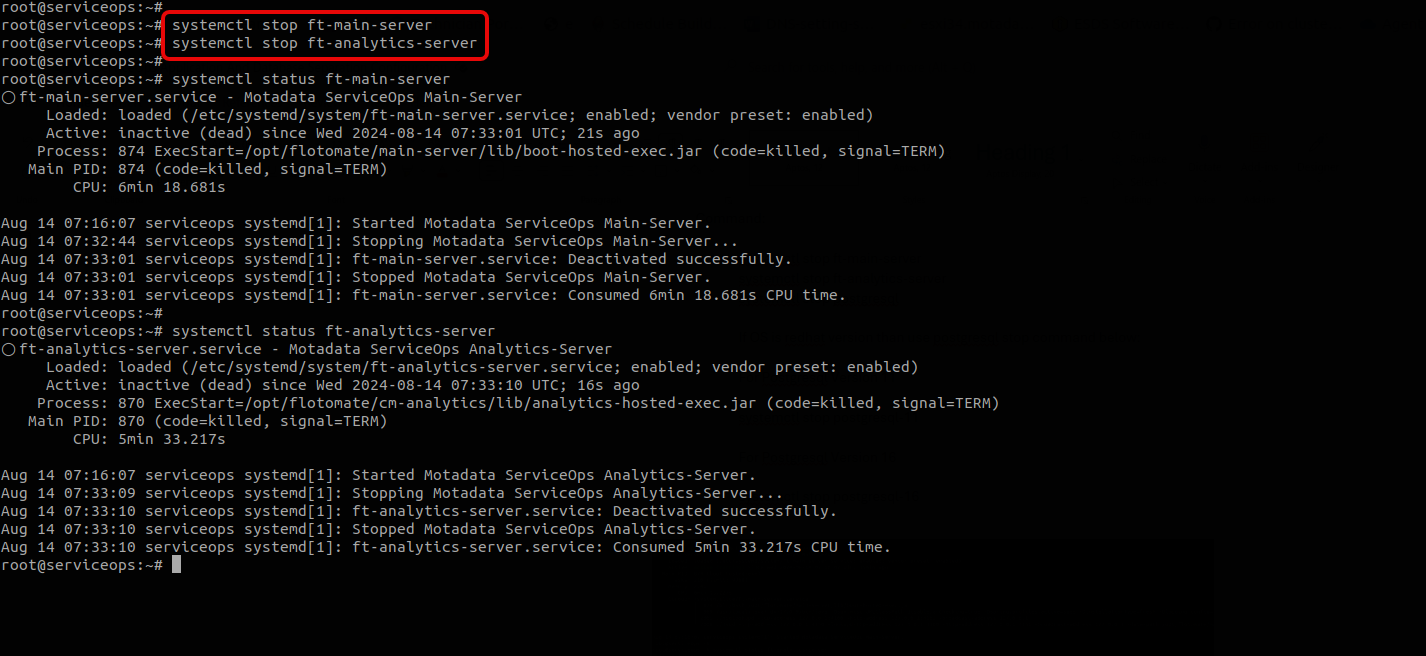
Stop PostgreSQL Service:
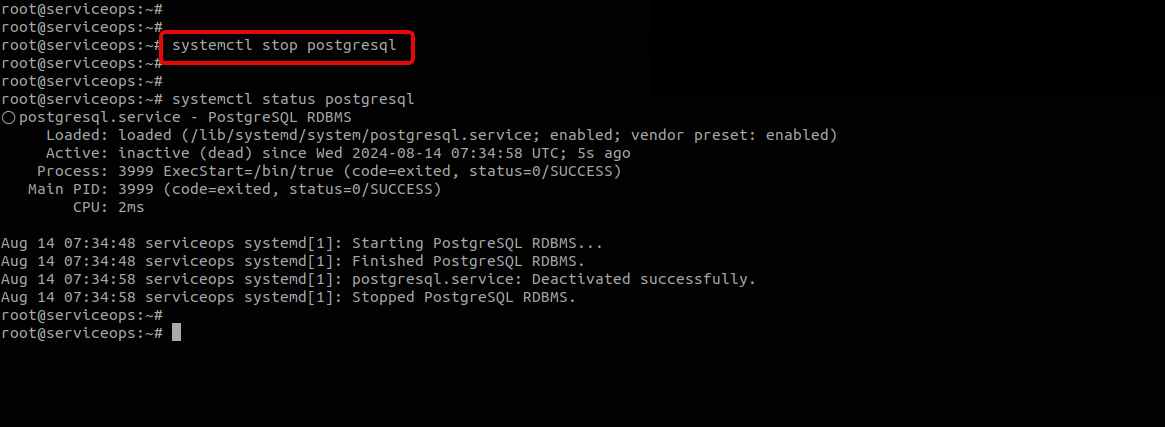
Ubuntu/Debian
systemctl stop postgresql
RHEL/CentOS
# For PostgreSQL 16
systemctl stop postgresql-16

# For PostgreSQL 17
systemctl stop postgresql-17
Verify Services are Stopped:
systemctl status ft-main-server
systemctl status ft-analytics-server
systemctl status postgresql
- Ensure all services are completely stopped before proceeding
- In High Availability (HA) environments, also stop the HA Observer service
- Verify that no processes are using the database before stopping PostgreSQL
Step 2: Prepare Database Server
2.1 Download Database Installation Utility
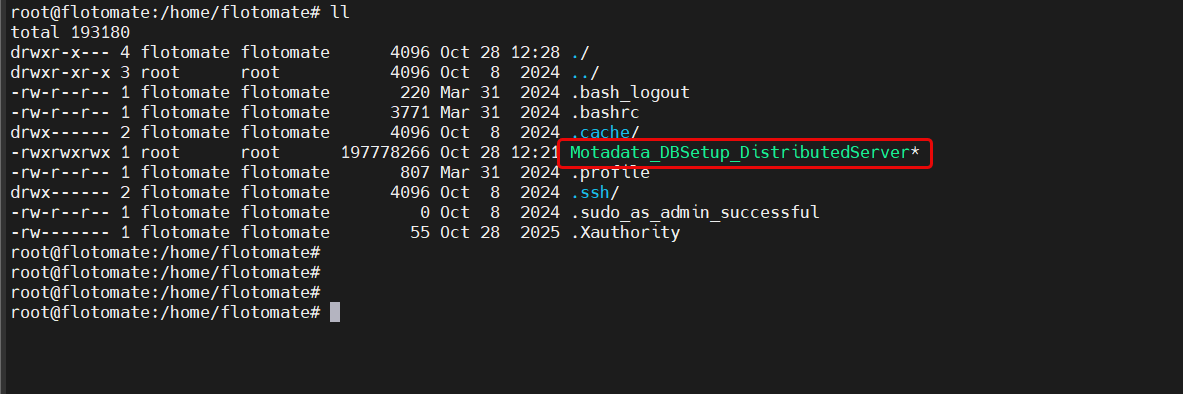
- Download the PostgreSQL Database Utility:
- Download Motadata_DBSetup_DistributedServer from the ServiceOps release repository.
2.2 Retrieve Database Password
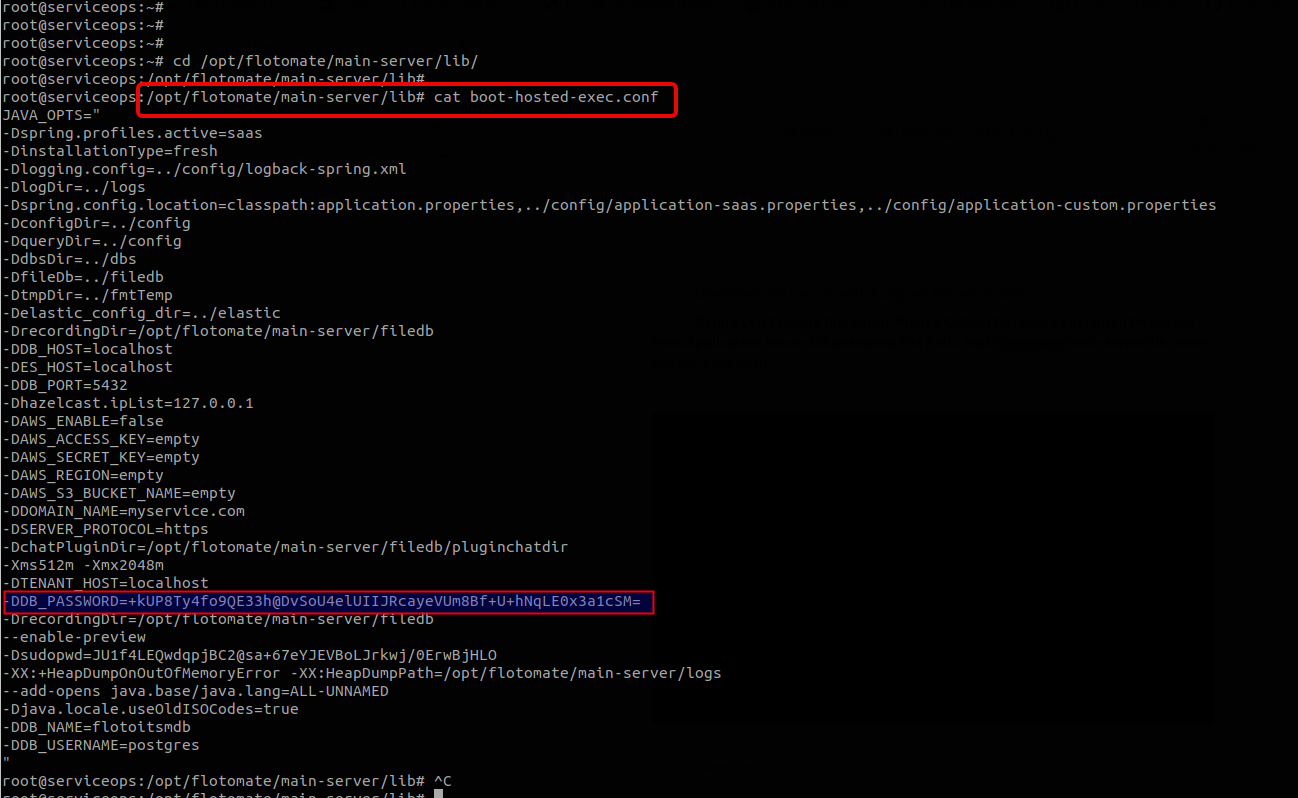
Get Database Password from Application Server:
On the application server, locate the database password in the configuration file:
cat /opt/flotomate/main-server/lib/boot-hosted-exec.confCopy the encrypted database password for use in the next step
2.3 Install PostgreSQL on Database Server
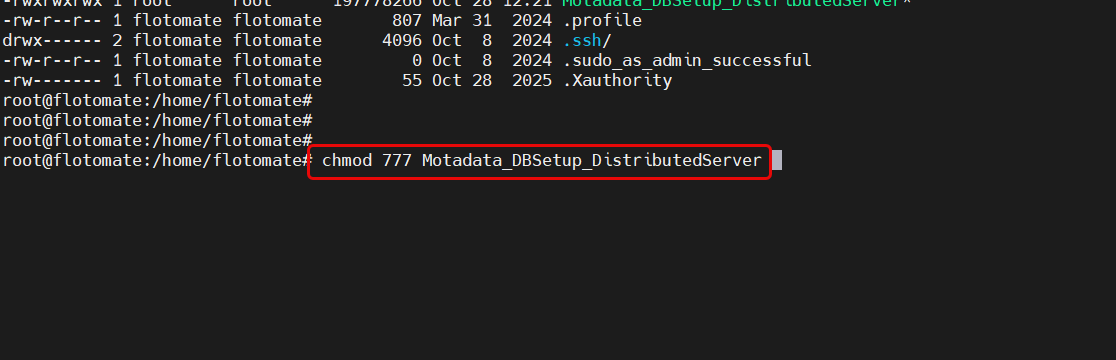
- Move to the directory where the utility is downloaded.
Set Permissions:
chmod 777 Motadata_DBSetup_DistributedServer
Verify whether PostgreSQL has already been installed on the Database Server. If installed, please delete it and install a fresh server for the database.
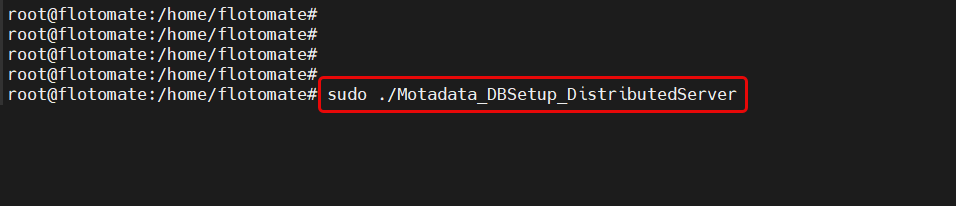
Run Installation Script:
./Motadata_DBSetup_DistributedServer
Follow the Installation Prompts:
- Enter database port (default: 5432)
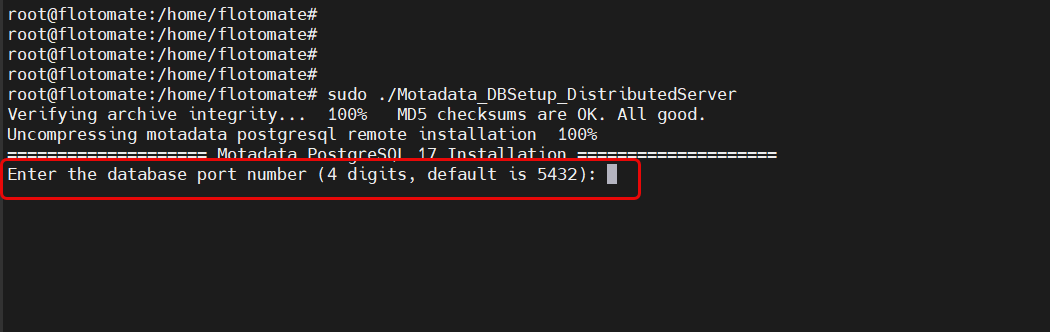
Confirm PostgreSQL 16/17 installation (enter "y")
Enter the database password retrieved from step 2.2
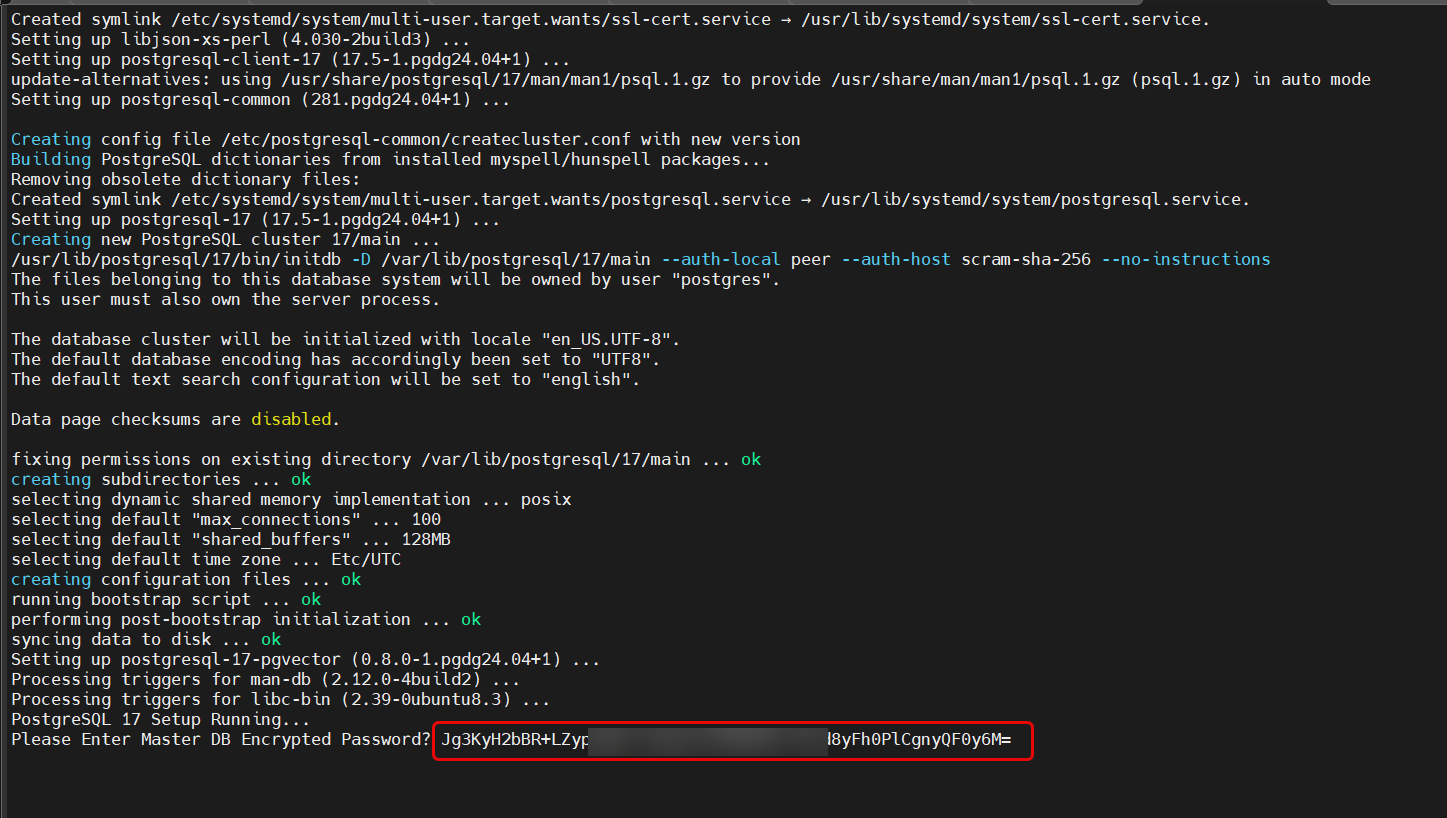
- Next, the DB password will be validated, and “DB Password Valid Match” will appear.
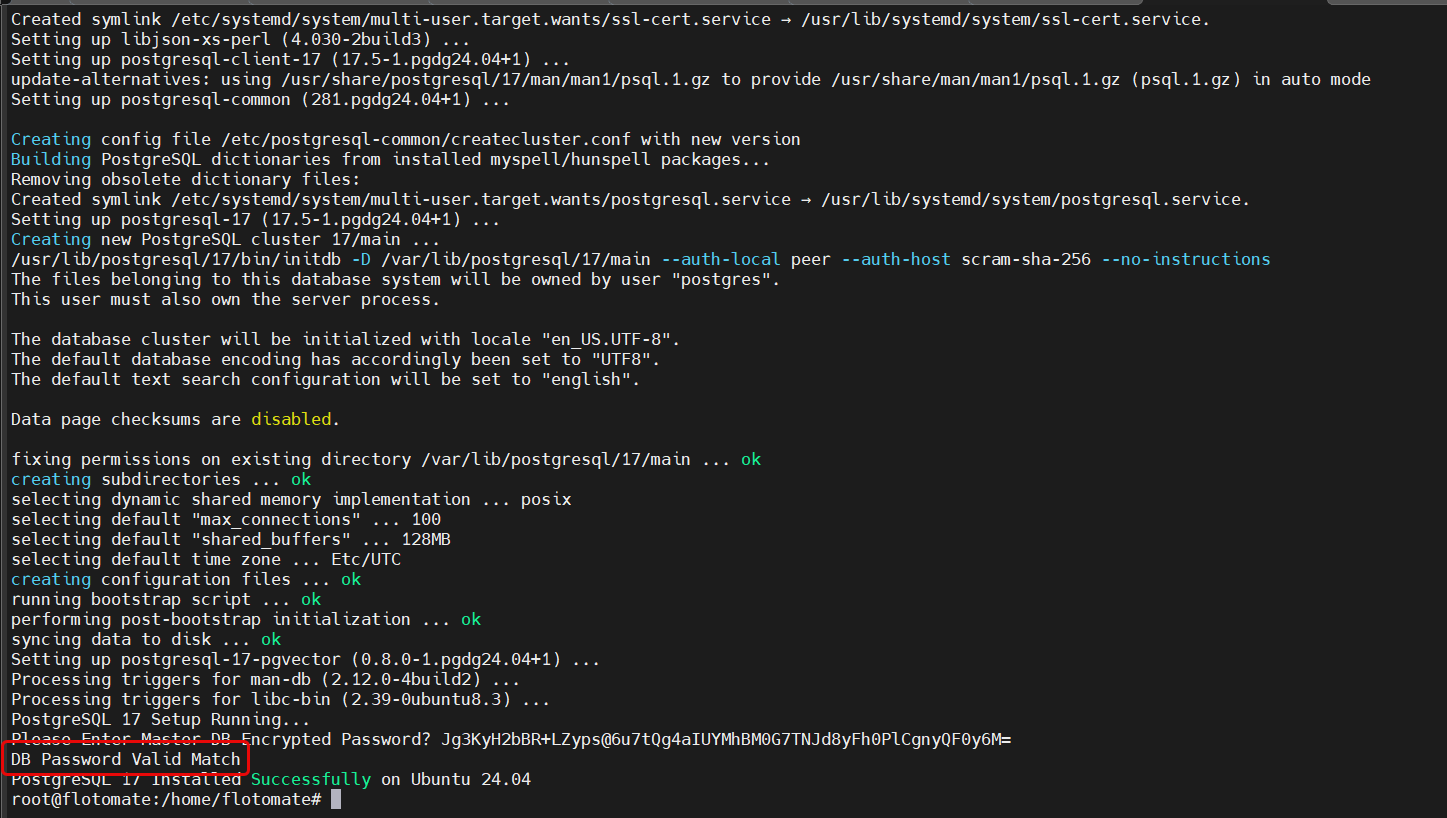
Once the database password is validated, the installation process will be completed, and a message, "PostgreSQL 16/17 installed successfully", will appear.
Verify Installation:
systemctl status postgresql
For RedHat OS v16, and 17:
systemctl status postgresql-16
systemctl status postgresql-17
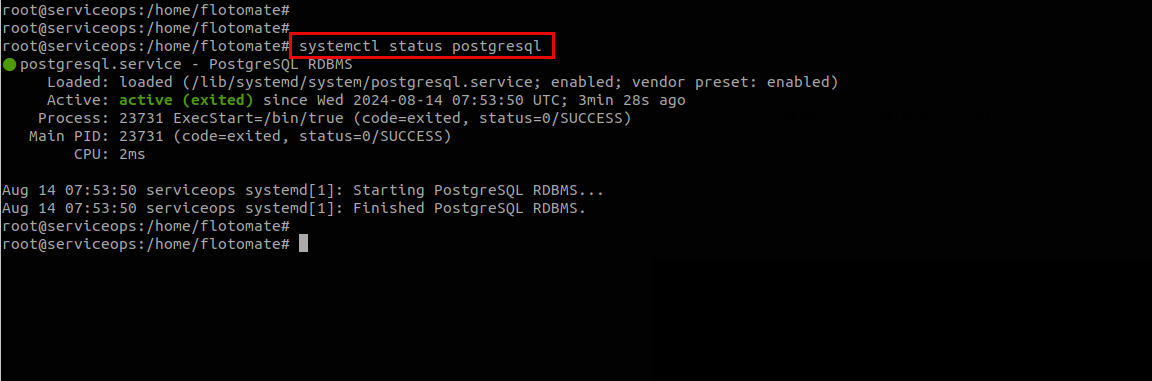
The installation is successful when you see:
- "PostgreSQL 16/17 fresh installed completed" message
- "DB Password Valid Match" confirmation
- PostgreSQL service running status
Step 3: Configure Application Server
Configure the application server to connect to the remote database server. You can do this manually or using the provided utility.
Option A: Manual Configuration
Edit Configuration Files:
Update the following configuration files on the application server, changing
DB_Hostfromlocalhostto the DB Machine IP address (For example: 172.16.13.40) in the following config files of the ServiceOps server::# Main application configuration
/opt/flotomate/main-server/config/application-saas.properties
# Analytics configuration
/opt/flotomate/cm-analytics/config/application-saas.properties
# Main server boot configuration
/opt/flotomate/main-server/lib/boot-hosted-exec.conf
# Analytics boot configuration
/opt/flotomate/cm-analytics/lib/analytics-hosted-exec.confFor example, here, application-saas.properties config file is edited to change the DB_Host name. Similarly, edit the remaining files.
Update Database Host: In each file, locate the database connection settings and update:
# Change from:
DB_Host=localhost

# To:
DB_Host=172.16.13.40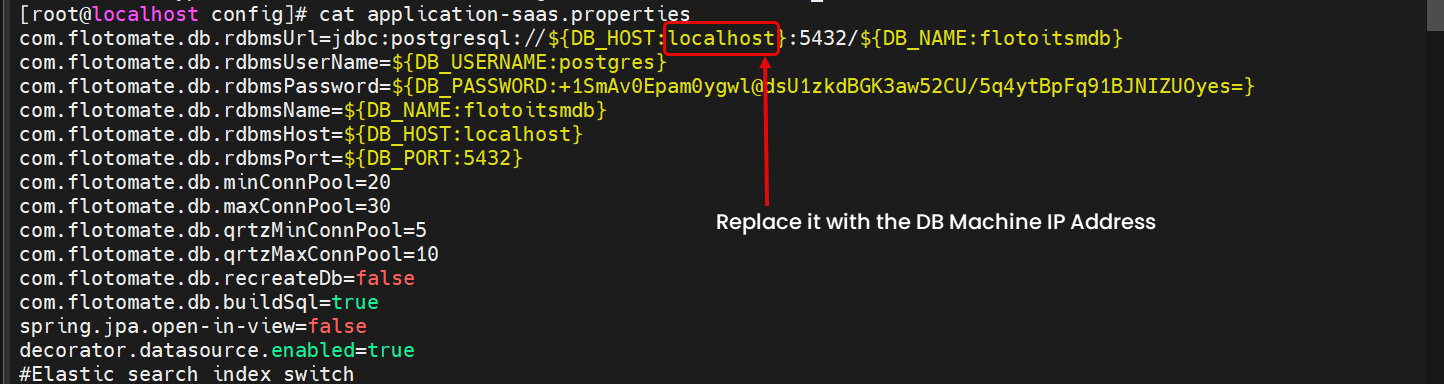
Option B: Using Configuration Utility
Download Configuration Utility:
- Download MotadataServiceDBSeparateConfig
- Extract the ZIP file on the application server
Set Permissions and Run:
chmod 777 MotadataServiceOpsDBSeparateConfig
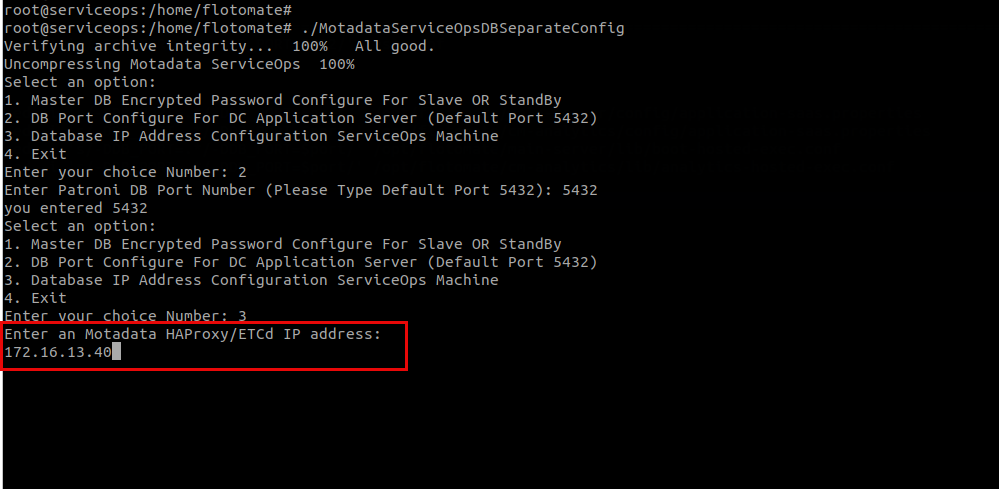
./MotadataServiceOpsDBSeparateConfig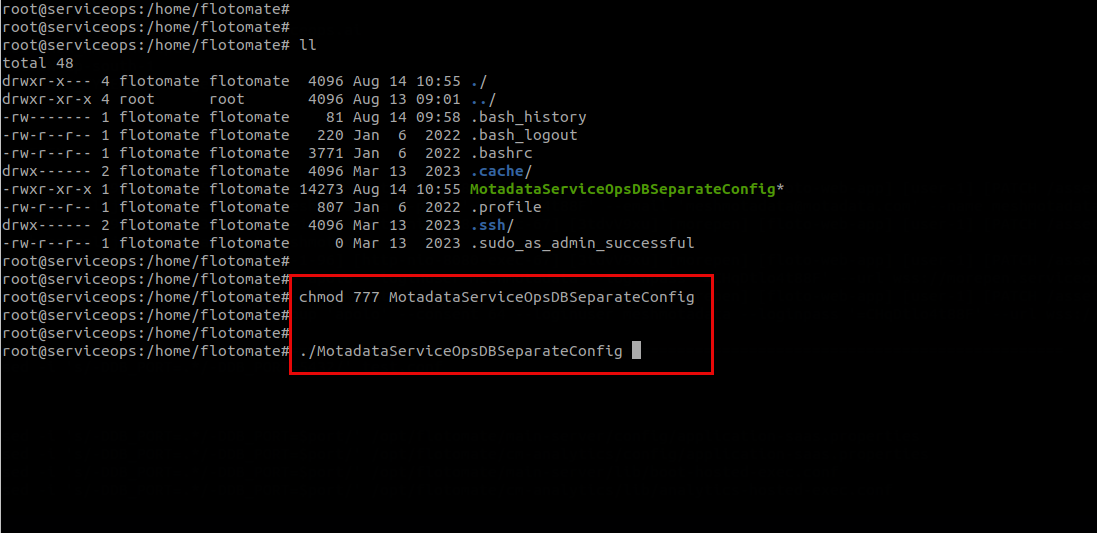
Configure Database Settings:
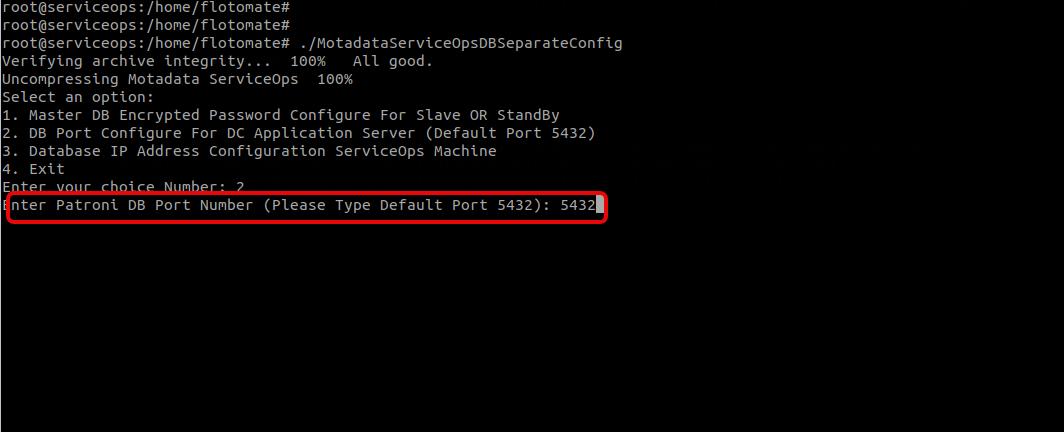
- Select option 2 to update database port (enter 5432)
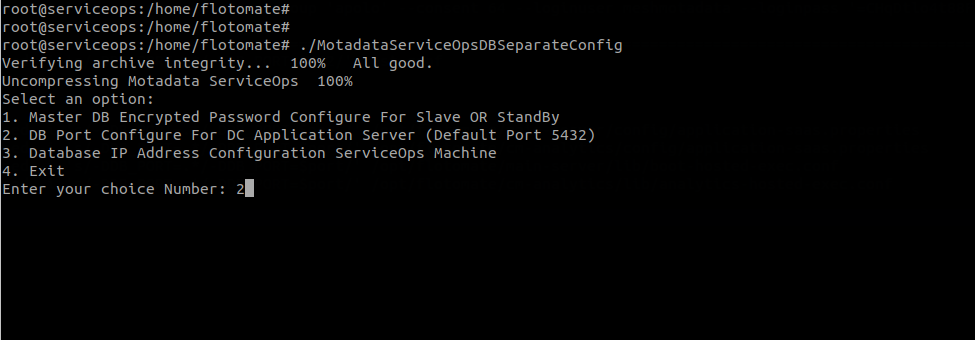
- Enter the database port number. By default, 5432 port for PostgreSQL.
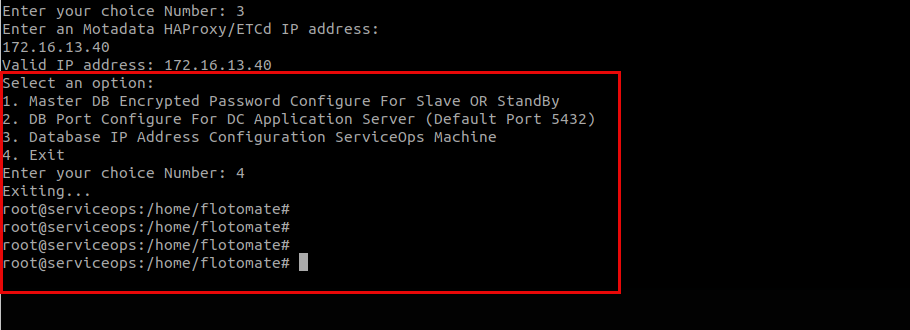
- Select option 3 to update database IP address (enter 172.16.13.40).
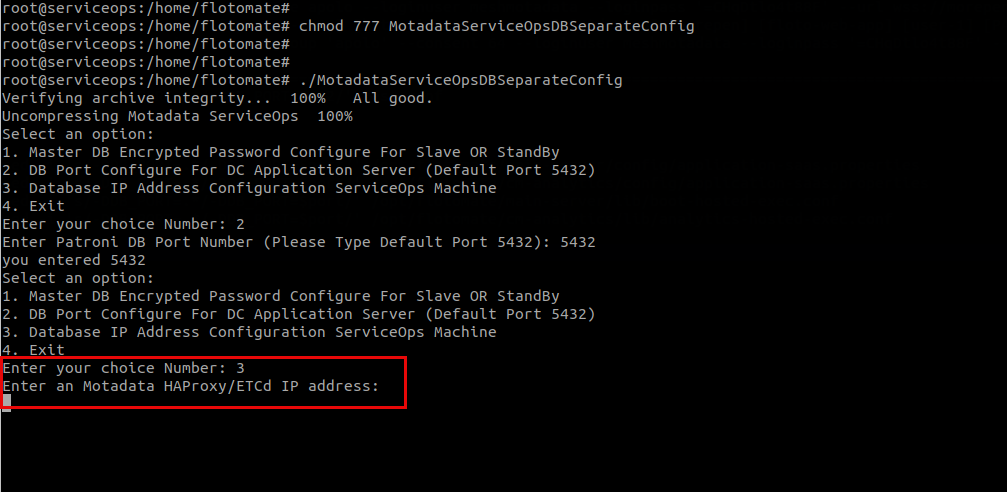
- Enter the Database server IP address. For example, 172.16.13.40
- Select option 4 to exit the configuration utility.
Step 4: Verify Configuration
Check Configuration Files: Verify that all configuration files have been updated correctly with DB port and Host IP Address:
/opt/flotomate/main-server/config/application-saas.properties
/opt/flotomate/cm-analytics/config/application-saas.properties
/opt/flotomate/main-server/lib/boot-hosted-exec.conf
/opt/flotomate/cm-analytics/lib/analytics-hosted-exec.conf
Test Database Connectivity:
# Test connection from application server to database server
telnet 172.16.13.40 5432

# Or use PostgreSQL client
psql -h 172.16.13.40 -p 5432 -U postgres
Verify Network Connectivity:
# Test basic connectivity
ping 172.16.13.40

# Test port connectivity
nc -zv 172.16.13.40 5432
Step 5: Start Services
Start ServiceOps Services:
systemctl start ft-main-server
systemctl start ft-analytics-server
Verify Service Status:
systemctl status ft-main-server
systemctl status ft-analytics-server
Post-Configuration Verification
Application Access Test
Access ServiceOps Web Interface:
- Open a web browser and navigate to
http://172.16.12.152orhttps://172.16.12.152 - Verify that the application loads correctly
- Test user login functionality
- Open a web browser and navigate to
Check Database Operations:
- Create a test incident or service request
- Verify that data is being stored and retrieved correctly
- Check that all modules are functioning properly
Your separate server configuration is successful when:
- Application connects to remote database without errors
- All ServiceOps modules function correctly
- Performance meets or exceeds single-server deployment
- Database backups and restores work properly
- Network connectivity is stable and low-latency
Performance Monitoring
Monitor Database Performance:
# On database server
psql -h localhost -U postgres -c "SELECT * FROM pg_stat_activity;"
Monitor Application Performance:
- Check application response times
- Monitor server resource utilization
- Verify network latency between servers
Backup Verification
- Test Database Backup:
# Verify backup functionality works with remote database
pg_dump -h 172.16.13.40 -U postgres serviceops > backup_test.sql
Troubleshooting
Common Issues
Connection Refused:
Problem: Application cannot connect to database server
Solution:
- Verify firewall settings on both servers
- Check PostgreSQL is running on database server
- Confirm network connectivity between servers
- Verify database server IP and port in configuration files
Authentication Failed:
Problem: Database authentication errors
Solution:
- Verify database password is correct
- Check PostgreSQL user permissions
- Ensure database user exists and has proper access rights
Performance Issues:
Problem: Slow application performance
Solution:
- Check network latency between servers
- Monitor database server resources
- Verify PostgreSQL configuration for remote connections
- Consider database connection pooling
Diagnostic Commands
Use the following diagnostic commands to troubleshoot the issues:
Check PostgreSQL status
systemctl status postgresql
Check PostgreSQL logs
tail -f /var/log/postgresql/postgresql-16-main.log
tail -f /var/log/postgresql/postgresql-17-main.log
Test database connection
psql -h 172.16.13.40 -p 5432 -U postgres -d serviceops
Check network connectivity
ping 172.16.13.40
telnet 172.16.13.40 5432
Check application logs
tail -f /opt/flotomate/main-server/logs/application.log
Security Considerations
Network Security
- Firewall Configuration: Restrict database port access to application server IP only
- VPN/Private Network: Use private network for database communication
- SSL/TLS: Enable SSL connections between application and database servers
- For detailed steps, refer to How to Configure SSL Between the Application and PostgreSQL Database Server
Database Security
- Strong Passwords: Use complex database passwords
- User Permissions: Limit database user permissions to minimum required
- Regular Updates: Keep PostgreSQL updated with security patches
Access Control
- SSH Access: Restrict SSH access to database server
- Monitoring: Implement logging and monitoring for database access
- Backup Security: Secure database backup files and locations
Performance Optimization
Database Server Optimization
# Memory settings
shared_buffers = 256MB
effective_cache_size = 1GB
work_mem = 4MB

# Connection settings
max_connections = 100

# Logging
log_statement = 'all'
log_duration = on
Network Optimization
- Dedicated Network: Use dedicated network interface for database communication
- Network Tuning: Optimize network settings for low latency
- Connection Pooling: Implement connection pooling in application
Monitoring and Maintenance
- Regular Monitoring: Monitor database performance and resource usage
- Index Maintenance: Regularly update database statistics and indexes
- Log Rotation: Implement proper log rotation for both servers